VWAP -Trade With Trend
What is the Volume Weighted Average Price (VWAP)?
The volume weighted average price (VWAP) is a trading benchmark used by traders that gives the average price a security has traded at throughout the day, based on both volume and price. It is important because it provides traders with insight into both the trend and value of a security. TradingView.
KEY TAKEAWAYS
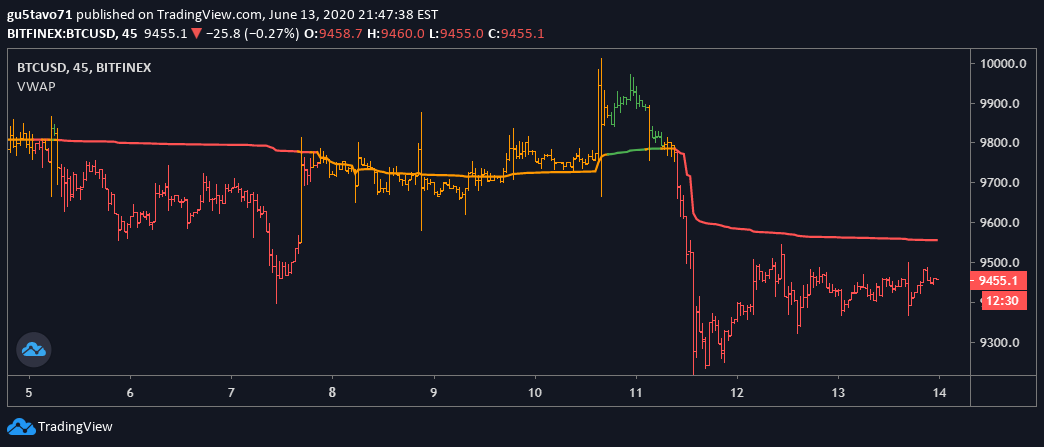
The volume weighted average price (VWAP) appears as a single line on intraday charts (1 minute, 15 minute, and so on), similar to how a moving average looks.
• A rising VWAP, and/or the price above the VWAP line, means the price is likely in an uptrend.
• A declining VWAP, and/or the price below the VWAP line, means the price is likely in a downtrend.
• Don’t rely on VWAP exclusively to determine trend, since it is only showing a historical average, and not what is happening currently or in the future.
• Investors may use VWAP to assess the price they paid for a security throughout the day. At the end of the day, if the price they bought at is higher than the VWAP, then they may have overpaid. If it is less than VWAP, then they purchased shares at a good price for that day.
The Formula for the Volume Weighted Average Price (VWAP) is
VWAP is calculated by adding up the dollars traded for every transaction (price multiplied by the number of shares traded) and then dividing by the total shares traded.
VWAP = ∑ Price X Volume / ∑ Volume
How to Calculate Volume Weighted Average Price (VWAP)
Volume Weighted Average Price
Adding the VWAP indicator to a chart will complete all calculations for you. To calculate the VWAP yourself, follow these steps. Assume a 5-minute chart; the calculation is same regardless of what intraday time frame is used.
1. Find the average price the stock 1. traded at over the first five-minute period of the day. To do this, add the high, low, and close, then divide by three. Multiply this by the volume for that period. Record the result in a spreadsheet, under column PV.
2. Divide PV by the volume for that period. This will give the VWAP value.
3. To maintain the VWAP value throughout the day, continue to add the PV value from each period to the prior values. Divide this total by total volume up to that point. To make this easier in a spreadsheet, create columns for cumulative PV and cumulative volume. Both these cumulative values are divided by each other to produce VWAP.
What Does Volume Weighted Average Price (VWAP) Tell You?
Large institutional buyers and mutual funds use the VWAP ratio to help move into or out of stocks with as small of a market impact as possible. Therefore, when possible, institutions will try to buy below the VWAP, or sell above it. This way their actions push the price back toward the average, instead of away from it. Retail traders tend to use VWAP more as a trend confirmation tool, similar to a moving average. When the price is above VWAP they look only to initiate long positions. When the price is below VWAP they only look to initiate short positions.
The Difference Between Volume Weighted Average Price (VWAP) and a Simple Moving Average
On a chart, VWAP and a moving average may look similar. These two indicators are calculating different things. VWAP is calculating the sum of price multiplied by volume, divided by total volume. A simple moving average is calculated by summing up closing prices over a certain period (say 10), and then dividing it by how many periods there are (10). Volume is not factored in.
Limitations of Using Volume Weighted Average Price (VWAP)
VWAP is a single-day indicator, and is restarted at the open of each new trading day. Attempting to create an average VWAP over many days could mean that the average becomes distorted from the true VWAP reading as described above.
While some institutions may prefer to buy when the price of a security is below the VWAP, or sell when it is above, VWAP is not the only factor to consider. In strong uptrends, the price may continue to move higher for many days without dropping below the VWAP at all or only occasionally. Therefore, waiting for the price to fall below VWAP could mean a missed opportunity if prices are rising quickly.
VWAP is based on historical values and does not inherently have predictive qualities or calculations.
If this Author or Course helped you make money or more money. It is really worth it if you go and buy his/her course. Get feedback and help by his/her community. The Author support is much more valuable than the course itself.